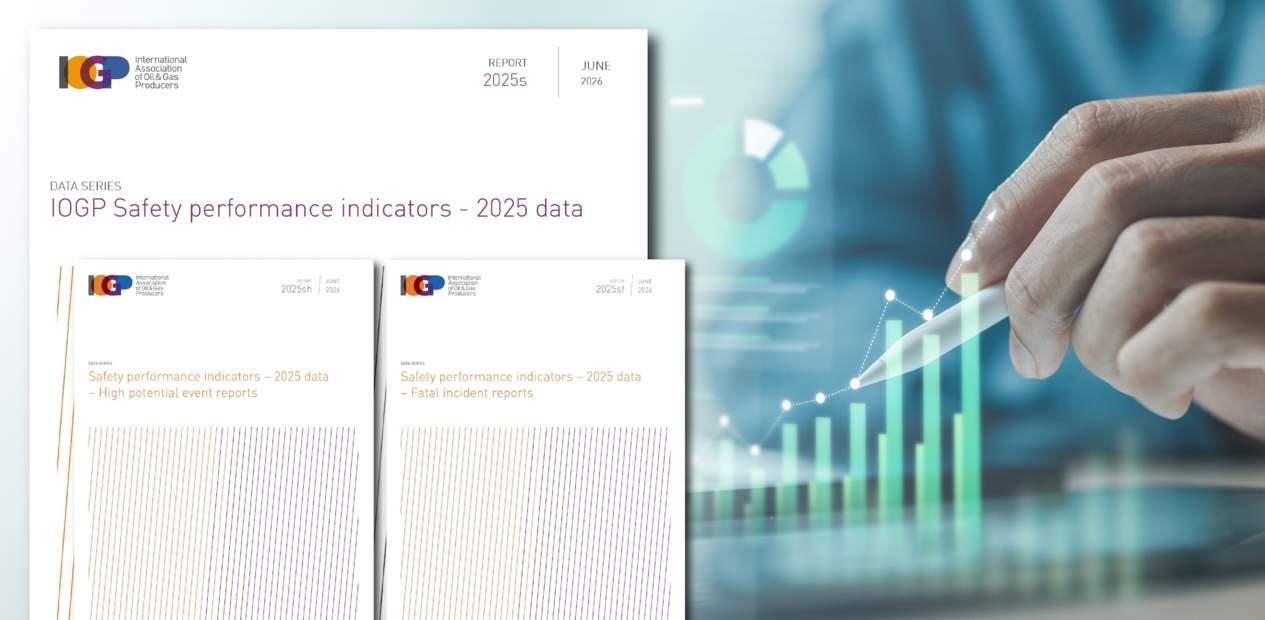
Safer Together has compiled safety performance data for the Australian Energy Production Industry for the first half of 2026. In June this year, IOGP released its Safety Performance Indicators – 2025 data reports. These reports summarise data provided by 56 companies from all over the world, representing 3.9 billion work hours. Together, the Safer Together and IOGP data certainly represent a call to action.
Safer Together collects, collates, analyses and reports safety performance data on behalf of the Queensland and WA/NT sectors of the Australian Energy Production Industry. We have recently compiled data for the first half of 2026. The key insights for the first half of 2026 are:
- There were no Fatalities or Permanent Impairments
- The rate of High Potential Events continues to increase. These Events did not result in a fatality, but they could have.
- 3 Serious Motor Vehicle Incidents occurred. This is concerning because these relate to a material risk in the onshore parts of our Industry. There have been numerous fatalities as a result of SMVIs in the past.
- There were 8 Process Safety Events (3 x Tier 1; 5 x Tier 2). This trend appears to be increasing.
- 115 people were injured across the industry, 17 lost work time due to the injury. There were 41 hand injuries in the period.
Safer Together uses Key Performance Indictors (KPIs) developed by the International Association of Oil and Gas Producers (IOGP) to monitor our Industry’s safety performance.
IOGP has been collecting safety incident data from its Member Companies globally since 1985. IOGP maintains the largest database of safety performance in the global upstream oil and gas industry. The IOGP incident reporting system covers worldwide upstream operations, both onshore and offshore, and includes incidents involving both Member Companies and their contractor employees.
On 18 June, IOGP published the Safety Performance Indicators – 2025 data reports: 2025 Data Report; 2025 Fatal Incident Narratives; 2025 High Potential Event Narratives; Executive Summary. The IOGP data shows:
- A substantial increase in fatalities (52) which, along with a 7% decrease in work hours reported, leads to a 75% increase in the Fatal Accident Rate vs 2024 and a 62% increase vs the previous 5-year average - this is despite a 6% reduction in Totable Recordable Injury Rate (TRIR) showing that while fewer people were injured, the severity increased.
- 5 events were multi-fatality (involving 17 fatalities), 35 events resulted in a single fatality.
- The most frequent cause of fatalities was line of fire exposures.
- The most frequent activities resulting in fatalities were maintenance, land transport and drilling.
- 85% of the fatal incidents involved breaches of IOGP Life-Saving Rules.
- Fatalities related to Process Safety were lower in 2025 compared to 2024, however the number of Tier 1 Process Safety Events was the same, and could have resulted in a higher number of fatalities.
- The most significant incident in 2025 was a Process Safety event involving a fire during maintenance work that resulted in 4 fatalities and 4 permanent impairments.
- There were 6 other Process Safety line-of-fire single fatality incidents.
- The frequency of Tier 2 Process Safety events increased against 2024.
Tom Frost (Health, Safety, Security and Wells Director, IOGP) puts it succinctly:
“This data is certainly a call to action. A pattern I see is inconsistent application and effectiveness of proven controls. This is most clear to me in the link between the 9 IOGP Life Saving Rules and the fatal incidents.
"Since publication in 2018 the majority of fatal incidents involved a breach of one of more LSR (75% to 93% annually). IOGP’s current safety work includes four key areas: adoption & implementation of IOGP guidance (greater reach to the front-line), human performance principles (cultural shift), leading indicators (intervene early), and specific areas of continued high risk informed by the safety data (avoid repeat incidents).
This enables the existing industry knowledge and guidance to be used to improve controls being in place and effective at the time and place required and to improve the resilience of the defence systems required to be more impactful on safety outcomes."
Safer Together has recently formally endorsed the IOGP Life-Saving Rules.
What else will Safer Together do?
Our Working Groups will continue with the 2026-2027 Work Plan to promote, monitor, maintain and support Products and Programs designed to minimise the risk of incidents that have the potential to result in fatalities or permanent impairments.
But there may be more we can do. We may need to do things differently. Perhaps we need to re-direct our priorities, ‘or double down’ on them.
Early in Q4, the Qld and WA/NT SLGs will conduct ‘deep dive’ workshops to analyse the data and define actions that can be taken by individual companies and/or by Safer Together. Output from these workshops will steer our Working Group activities and the 2026-2027 Work Plan. It will also inform the next Safer Together Strategic Plan which will be published in Q1 2027, and associated prioritisation of resource allocation.
What can you do?
If you would like to contribute to this conversation, you are welcome to join a Working Group and get involved, we always welcome new members. Follow this link to nominate, or email us: [email protected].
The Safer Together Safety Culture Framework describes the behaviours expected from everyone in our Industry to drive success in safety. Key expectations include:
- Speak Up: Intervene to stop unsafe work or behaviours and seek clarification.
- Get Involved: Take ownership of HSE issues and share learnings.